Workout Log in Obsidian
I’ve been using Obsidian as a personal journal and goal keeping device for a couple years now and have always felt that I’ve been underusing it. It’s a fantastic tool for building up notes on a variety of subjects, but its main strength comes from linking notes together, giving you the ability to create a knowledge graph simply by referencing other notes in the note you’re writing.
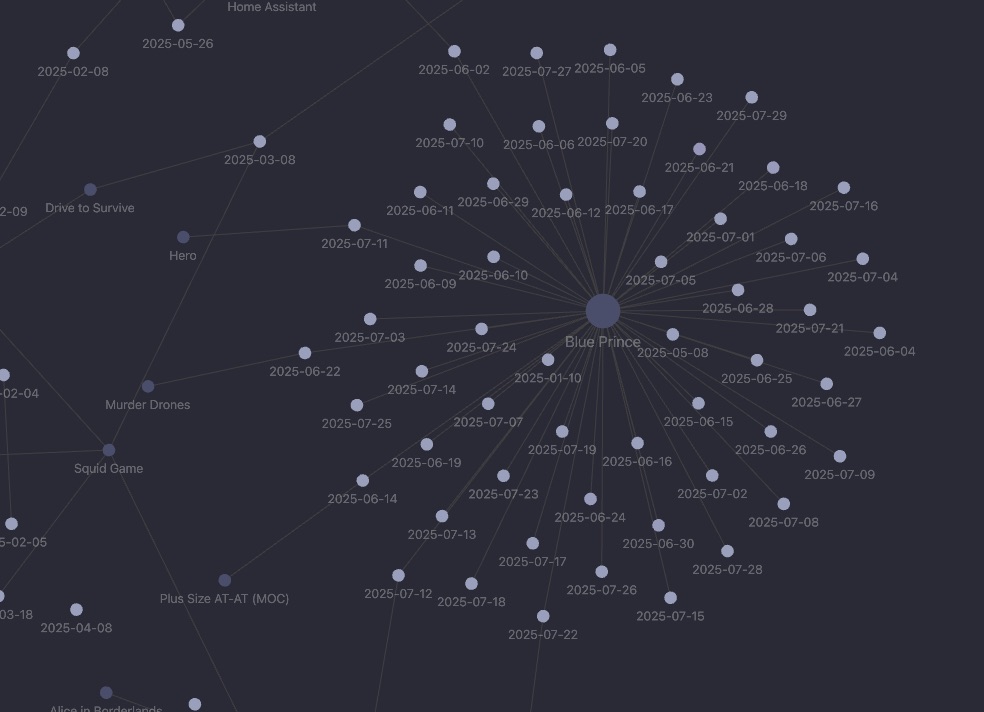 Incidentally, any guesses as to what game I’ve been playing lately?
However, one of the huge things about Obsidian is the powerful plugins the community has provided; everything from Dataview - which basically turns your notes vault into a database which you can query - to Visual Crossing Weather - which adds the current weather and forecast to the status bar and as a template you can insert into notes. One can use these to make fairly intricate applications which allow you to record data across days/weeks and then report them on one page.
I mean, this isn’t novel behavior, but considering it can do all this while being integrated with the simple note-taking functionality, it’s pretty powerful.
Workouts
So, I wanted an easier way to track my workouts. I was already using Obsidian, but it was a very manual process: I had to type in the weights and reps for each of my exercises for every workout; this took me probably 4 whole minutes each workout. What a slog!
But the real issue was I had no way of tracking my improvements over time, which is something I wanted a lot. So when I decided to solve that, I looked into solving some of my other complaints as well:
- I don’t want to have to do manual calculations since this is prone to error
- warmup weights
- strength vs hypertrophy phase
- I don’t want to manually create my workout logs since it’s not easy on my phone
- I want one place where I can see the current weight of all my exercises
- I want historic graphs for improvements over time for all my exercises
With this in mind, I got to work. I’m not going to talk too much about the iterative process; just know that there was one. This took me a couple days to polish and, while it’s still not “perfect”, it does what I want it to do within the parameters I accept.
Assumptions
Before we get started, I want to cover some things that will be assumed. If these assumptions don’t match what you want, then you’ll have to consider that in how you want to proceed
Plugin prerequisites
For this setup, you’ll need a few plugins:
- Templater - Provides advanced templating abilities for notes
- Dataview - Mentioned above; enables querying data from other notes
- Charts - Makes it possible to render all types of charts from provided data
- Meta Bind - Makes your notes interactive by allowing form-style interactions, like buttons
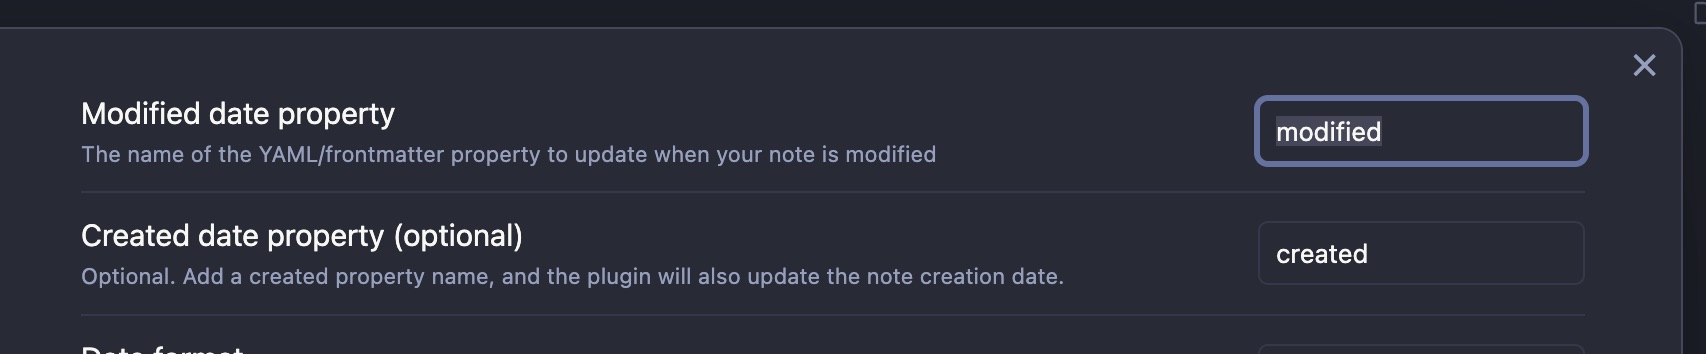
- Update Frontmatter Modified Date - Keeps an up-to-date
createdandmodifiedfield in notes
I’m not gonna go into how to set each of these up since a) it’s a lot and b) most of the config isn’t relevant to what we’re doing. The only thing I’ll specify is in the modified date plugin, you need to set it up with modified and created as the modified and created dates, respectively.
Workout structure
I do two different weight training sessions per week: push exercises (bench press, squats, etc) on Tuesdays and pull exercises (curls, lat pulldowns, etc) on Thursdays. Each week I do the same exercises so every Tuesday is the same, and every Thursday is the same. Thus, I have two different log formats, one for each. If you have more or fewer types of workouts, then you’ll want to add or reduce log templates and types; I’ll show you where to make this change later.
I also go through two phases, strength (more weight, fewer reps) and hypertrophy (fewer reps, more weight) on a 6-week cycle. These are the same exercises, just changing weights/reps, so I look for those places in the template and make the changes pending on which I select. I’ll also show you where to make a change if you have a different number of phases.
File and folder structure
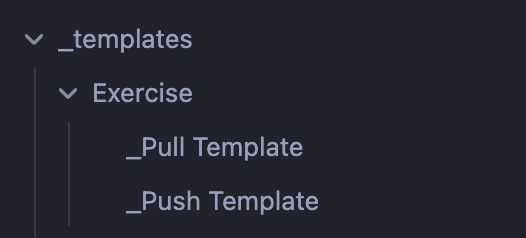
I decided to group all my exercise logs in one place, a top-level Exercise folder. Within that folder, I have a subfolder for all my exercise log notes and then three other notes. Also, separately, I keep all my templates in a top-level folder called _templates. The overall view looks like this:
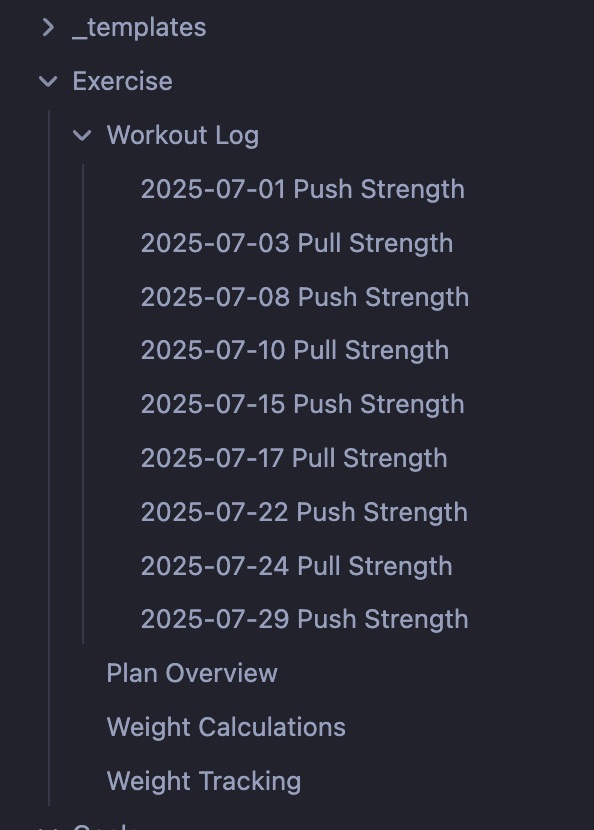
Those three other notes serve different purposes to me, but you may not want/need two of them:
Weight Tracking- this one is where all the functionality is, historical and current weightsPlan Overview- basically a description of my holistic plan; not neededWeight Calculations- a lookup table of weight conversions; not needed
Within the _templates folder, I have a subfolder specifically for the templates needed for my exercise tracking
I’ll cover this a bit more, but you’ll want one of these templates for each exercise day (assuming you consistently do the same thing on workout days).
Weight tracking page, part 1
We’ll start with the first part of the Weight Tracking note since the templates build on that, and then the second part of the Weight Tracking note references the individual workout logs.
All we’re going to do is set up the exercises we do and our current one-rep-max (1RM) weight for each.
This is why I have the weight calculations page; I have no idea what my 1RM actually is, but I can get a reasonable estimate from what I’m currently lifting. For example, if you’re just barely finishing 6 reps in good form of an exercise, that’s approx 85% of your 1RM; there are similar calculations for hypertrophy phase. I just asked ChatGPT to generate a table with all these numbers for a range which I think is realistic :-p
For this, we’re going to be using the Dataview inline metadata formatting:
1
2
3
4
5
6
7
8
9
10
11
12
13
14
15
16
17
# Current Weights (reference)

## Push

[inclineBenchPress:: 100]
[squat:: 190]
[overheadDbPress:: 45] (each)
[cableFly:: 65] (each)
[tricep:: 120]

## Pull

[barbellRow:: 125]
[deadlift:: 125]
[latPulldown:: 135]
[dumbbellCurl:: 30] (each)
[farmerCarry:: 65] (each)
Using this format, we can now reference these values in other notes using programmatic lookups, so let’s go do that now
Workout log template
Rendered page
For each workout, we’re going to be recording several pieces of information; some of them will be used by the tracking we’ll set up, and some of them are just for us to use at the gym. I’ll put an example of the rendered log (not the template) as an example. This is, of course, truncated a bit for brevity
1
2
3
4
5
6
7
---
created: 2025-07-31
modified: 2025-07-31
tags:
  - exercise
  - workoutLog
---
The frontmatter above is needed for reporting, specifically the created field and the tag workoutLog
1
2
3
4
# 🏋️♂️ Workout: Pull + Legs (Strength Phase)
exerciseGroup:: pull
exercisePhase:: strength
This simply records the exercise group and phase for potential future reporting; I haven’t used it yet, but it’s cheap to add now.
1
2
3
4
5
## Current Theoretical One Rep Max

- Barbell Row: (barbellRow:: 125)
- Romanian Deadlift: (deadlift:: 125)
... more exercises go here
This describes the theoretical max this week and will be used for tracking. These are populated from the weight tracking page and also use the Dataview inline metadata format, but the parentheses mean that only the value shows. This just makes it a touch nicer to look at IMO
1
2
3
4
5
## Warm-Up

- [ ] Barbell Row – Warm-up: 80 lbs
- [ ] Romanian Deadlift – Warm-up: 80 lbs
... more exercises go here
These values are also populated from the tracking page, but have a multipler applied to them
1
2
3
4
5
6
7
8
9
10
11
12
13
14
15
16
17
18
19
## Working Sets

Rest 90-120 seconds between pairs of sets (Incline, deadlift, rest)

### 🔁 Superset 1

Barbell Row: 105 lbs x 6
Romanian deadlift: 105 lbs x 6

6 reps each

- [ ] Barbell Row – Set 1
- [ ] Romanian deadlift – Set 1
... rest of the set


... more sets/supersets as appropriate

## 📝 Notes
These are all instructions to me on which exercises to do, how many reps, etc. when I get to the gym.
Template
Now that we know what we’re going for, let’s build a template which can render all of this for us.
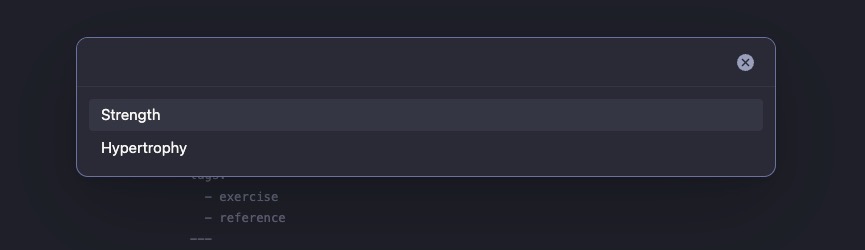
For this, we need to also know the intent of how this page is to be rendered. We’re going to create a set of buttons, one per workout type, on the Weight Tracking page. When we tap on a button, it’s going to ask us which phase of workout (in my case, “strength” or “hypertrophy” as mentioned before), and it will ask us the date of the workout, defaulting to today (in case I want to create a workout log beforehand). With that in mind, let’s start the template. This uses the templating syntax from the Templater plugin
First, we have to add the frontmatter; it can’t go after anything else
1
2
3
4
5
6
7
---
created:  (this is blank intentionally)
modified: (this too; they'll be filled in on the real page)
tags:
  - exercise
  - workoutLog
---
Directly after that, we’re going to build a bunch of variables that will be used later in the template; centralizing the logic here makes it easier to view the actual template since we don’t have to have a bunch of funky stuff in with the layout stuff.
1
2
3
4
5
6
7
8
9
10
11
12
13
14
15
16
17
18
19
20
21
22
23
24
25
26
27
28
29
30
31
32
33
34
35
36
37
38
39
40
41
42
43
44
45
46
47
48
<%*
// shortcut which allows us to use the dataview javascript API
let dv = DataviewAPI;

// fetches a reference to the Weight Tracking page
let weights = dv.page('Exercise/Weight Tracking.md');

// asks the user what type of workout this log will be for
// If you have more types of workout, this is where you will add that information
let workoutType = await tp.system.suggester((item) => item, ["Strength", "Hypertrophy"]);

// sets multipliers for the working weight based on the workout type, and for the warmup
let mult = workoutType == "Strength" ? .85 : .70;
const warmupPct = .75

// a list of the exercises for today; the key here is a universal key and is the one on the
// Weight Tracking page, the value is the human-friendly name
const exercises = {
	"barbellRow": "Barbell Row",
	"deadlift": "Romanian Deadlift",
    // ...
}

// containers for the different types of weights
let maxes = {}
let working = {}
let warmup = {}

// a function that rounds to the nearest 5lbs
function nearestFive (num) {
	return Math.round(num / 5) * 5;
}

// go through the exercises; for each, get the weights from the Weight Tracking page, multiply
// by the appropriate multiplier, round to the nearest 5lbs, and add it to the appropriate
// container
for (const exerciseKey in exercises) {
	maxes[exerciseKey] = nearestFive(weights[exerciseKey])
	working[exerciseKey] = nearestFive(weights[exerciseKey] * mult)
	warmup[exerciseKey] = nearestFive(weights[exerciseKey] * mult * warmupPct)
}

// Prompt the user for the date, defaulting to today
let date = await tp.system.prompt("Date?", tp.date.now("YYYY-MM-DD"));

// rename the file using today's date and the selected workout type
await tp.file.rename(date + " Pull " + workoutType);
%>
Now that we have all the data we need, let’s render the data into the actual workout log. For each of these, you can reference what it ends up looking like up above in the rendered example. First, we print the group of this file (in this case, pull) and the workout type chosen earlier; since they’re in dataview inline metadata format, they can be used for other reports
1
2
3
4
# 🏋️♂️ Workout: Pull + Legs (<% workoutType %> Phase)
exerciseGroup:: pull
exercisePhase:: <% workoutType.toLowerCase() %>
Go through each of the max weights and print each exercise along with its weight
1
2
3
4
5
## Current Theoretical One Rep Max

<%* for (const exerciseKey in exercises) { _%>
- <% exercises[exerciseKey] %>: (<% exerciseKey %>:: <% maxes[exerciseKey] %>)
<%* } _%>
Go through each of the warmup weights and print each exercise along with the weight
1
2
3
4
5
6
7
{% highlight plaintext %}
## Warm-Up

<%* for (const exerciseKey in warmup) { _%>
- [ ] <% exercises[exerciseKey] %> – Warm-up: <% warmup[exerciseKey] %> lbs
<%* } _%>
{% endhighlight %}
Finally, use the working group to print the weights to use at the gym
1
2
3
4
5
6
7
8
## Working Sets

Rest 90-120 seconds between pairs of sets (Incline, deadlift, rest)

### 🔁 Superset 1

Barbell Row: <% working['barbellRow'] %> lbs x 6
Romanian deadlift: <% working['deadlift'] %> lbs x 6
Once we’ve added all our exercises and grouped them as desired, we save this as a template; in my case, I saved this one as _templates/Exercise/_Pull Template. Now that we have a template, we can start using it. We can test it by right-clicking on the folder where we want to store our workout logs and selecting “Create new note from template”; in my case, that folder is Exercise/Workout Log. You’ll be prompted to select a template, so find the one we just saved. We’ll see two prompts pop up, asking us to select the workout type, then to input the date

Assuming you chose “Strength” and “2025-08-01”, you should see a new file in the workout log folder titled “2025-08-01 Pull Strength”. Congrats! Now to wire this up to a button.
Buttons
One of the goals I had was to create a workout by just tapping a button instead of manually creating a page since I may be doing this from my phone which doesn’t have right click. So, let’s do that now. We’ll open up the Weight Tracking main page again and add this code
1
2
3
4
5
6
7
8
9
```meta-bind-button
style: primary
label: Log Pull Workout
actions:
  - type: templaterCreateNote
    folderPath: Exercise/Workout Log
    templateFile: "_templates/Exercise/_Pull Template.md"
    openNote: true
```
This uses the metabind plugin to create a button which uses the templaterCreateNote action to generate a note from the _templates/Exercise/_Pull Template.md template, save it to Exercise/Workout Log, and then open it. Feel free to test it; you should see the same prompts as when we tested it before. Now you can add however many buttons as you have workout groups; I have one button for each push and pull.
Charts
At this point, we’re almost done; we just need to add charts showing our imiprovements over time. It’s helpful to have some data already so you can see what the chart will look like, but it’s not needed. I wanted a simple line graph showing the max weight going up over time, and one for each of my workout groups (push and pull). So what we’ll do is fetch the relevant notes, grab the information we want from each note, and then put it into a data format for the charting library. This will use both Dataview and the Charts plugins, the former for gathering data, the latter for rendering it.
This is a bit larger, and I’m gonna keep it in one code block, but we’ll document it along the way to see what each step is doing
1
2
3
4
5
6
7
8
9
10
11
12
13
14
15
16
17
18
19
20
21
22
23
24
25
26
27
28
29
30
31
32
33
34
35
36
37
38
39
40
41
42
43
44
45
46
47
48
49
50
51
52
53
54
55
56
57
58
59
60
61
62
63
64
65
66
67
68
69
70
71
72
73
74
75
76
77
78
79
80
81
82
83
84
85
86
87
88
89
90
91
92

// this fetches all the workouts we are interested in; starting with all
// pages in the relevant directory with the `workoutLog` tag in frontmatter,
// then filtering out any that does not have a `pull` exerciseGroup, and finally
// sorted by the date it was created
const pages = dv.pages('"Exercise/Workout Log" and #workoutLog')
  .where(p => p.exerciseGroup === "pull")
  .sort(p => p.created);

// Pick the exercises we care about
const exercises = [
  "barbellRow",
  "deadlift",
  ...
];

// Choose some colors that look nice and map them to the exercises
const colors = {
  barbellRow: '#ff595e',
  deadlift: '#ffca3a',
  ...
}

// Create a container for labels and initialize the datasets into a format the
// charting library expects
const labels = [];
const datasets = exercises.map(ex => ({ label: ex, data: [] }));

// Go through each workout log to gather information
for (const page of pages) {

  // add the workout log's date to the labels
  const date = dv.date(page.created).toFormat("yyyy/MM/dd");
  labels.push(date);

  // Loop through the exercise names (`ex`)
  exercises.forEach((ex, idx) => {
    // fetch the value we set on the workout log page for this exercise. The
    // 0 is there in case we had a problem looking up the data and to prevent
    // graph rendering failures. If you get a 0, you should be able to debug,
    // find out why this exercise name couldn't be found; maybe a typo.
    const value = page[ex] ?? 0;

    // add it to the data, along with color information
    datasets[idx].data.push(value);
    datasets[idx].borderColor = colors[ex];
    datasets[idx].backgroundColor = colors[ex];
  });
}

// Due to the way the charting library works, we have to make a plugin to
// color the background; this makes it a light grey
const plugin = {
  id: 'customCanvasBackgroundColor',
  beforeDraw: (chart, args, options) => {
    const {ctx} = chart;
    ctx.save();
    ctx.globalCompositeOperation = 'destination-over';

    // change this to a different color if you want
    ctx.fillStyle = '#cccccc';

    ctx.fillRect(0, 0, chart.width, chart.height);
    ctx.restore();
  }
};

// Build the chart data object in a format that the charting library expects.
// This includes rendering options as well as including the dataset and label
// information created earlier
const chartData = {
  type: "line",
  data: {
    labels,
    datasets
  },
  options: {
    responsive: true,
    plugins: {
      colors: {
	    enabled: true
      },
      title: {
        display: false
      }
    }
  },
  plugins: [plugin]
}

// Call the Obsidian Charts plugin's renderer
window.renderChart(chartData, this.container);
That should render a chart which looks something like this
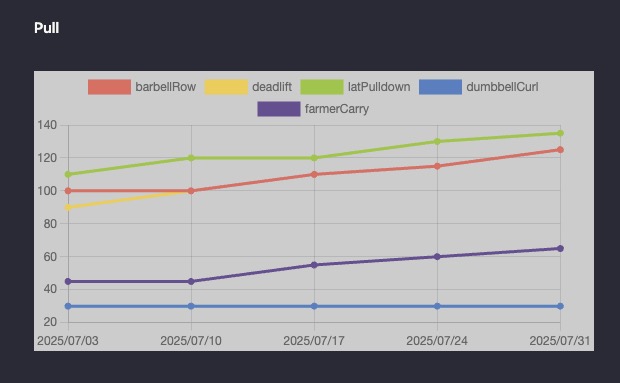
Now just do the same for each group, and you have your reporting page all set up. Congrats!
Usage
With all that, we have a full workout log system. Here’s how I use mine:
- Make sure that the weights for each workout on the Weight Tracking page are your one-rep-max (if you don’t know what that is, you can estimate)
- On workout day, tap the appropriate “Log Workout” button and enter the relevant details
- Go workout, following the weights indicated. I take notes, noting how much effort I expended and whether I should increase my weight (e.g. I’m getting through all reps fairly easily and in good form)
- Once done with the workout, go back to the Weight Tracking page and update any weights that need to increase or decrease
- Repeat week over week
As long as you keep the weights on the Weight Tracking page up to date, you’ll keep getting a workout that’s challenging as well as seeing the history of your max weight increasing.
Now the only thing left to do is go to the gym and do the work, which I can’t help with besides saying “you got this!”. Thanks for reading!